Are you considering a career in roofing? Understanding the gravity of the safety risks in this industry is crucial. The statistics on workplace safety for roofing contractors are not just concerning; they’re alarming.
At Roofing Webmasters, we help both new and established roofing companies build their brands and attract more customers. However, we also understand the risks our clients take whenever they enter the workplace.
In the following article, we’ll delve into the statistics about roofing accidents, fatalities, and the inherent dangers of this industry. These statistics are not to be taken lightly, as they highlight the gravity of the situation.
How Dangerous is Roofing?
Roofing is one of the most dangerous industries for workplace accidents and fatalities. According to the Bureau of Labor Statistics, 134 roofers died within the last recorded year, resulting in a 51.8 work injury rate, the third highest among all industries.
Roofing Deaths Per Year
Nearly 115 roofers die per year, based on data from the past six years.
| Year | Deaths |
|---|---|
| 2023 | 134 |
| 2022 | 124 |
| 2021 | 115 |
| 2020 | 108 |
| 2019 | 111 |
| 2018 | 96 |
| Average | 114.6 |
Source: Bureau of Labor Statistics
Deaths by Roofing Sector
Thirty-two residential roofers suffered fatal workplace injuries, along with 21 nonresidential roofers. That leaves 81 workers that fall into neither category.
The remaining fatalities might include people working in the roofing industry as contractors, maintenance or laborers. Alternatively, some fatalities may be classified under broader occupational designations like building maintenance or construction.
| Sector | Deaths |
|---|---|
| Residential Roofers | 32 |
| Nonresidential Roofers | 21 |
| Other | 81 |
Source: Bureau of Labor Statistics
Discrepancies Between Industry and Occupation
The data on roofing as an occupation reveals slightly fewer fatal work injuries than the broader industry. In this case, roofing as an occupation resulted in 113 fatalities, 21 fewer than as an industry.
Death Rate for Roofers
Roofers have a fatal injury work rate of 51.8, which is calculated per 100,00 full-time equivalent workers. Although the rate decreased from the previous year, roofing remains the second most deadly civilian occupation after logging.
| Occupation | Deaths | Fatal Injury Rate |
|---|---|---|
| Logging workers | 52 | 98.9 |
| Fishing and hunting workers | 19 | 86.9 |
| Roofers | 113 | 51.8 |
| Refuse and recyclable material collectors | 41 | 41.4 |
| Aircraft pilots and flight engineers | 62 | 31.3 |
Source: Bureau of Labor Statistics
Roofing Accidents Per Year
According to the Bureau of Labor Statistics, roofers sustained 7,100 total injuries or illnesses in the last recorded year, accounting for a 3.6 injury rate per 100 works.
The total number of injuries increased by 16.39% from the previous year.
| Year | Injuries | Rate per 100 |
|---|---|---|
| 2021 | 7,100 | 3.6 |
| 2020 | 6,100 | 3.3 |
| Average | 6,600 | 3.45 |
Source: Bureau of Labor Statistics
Nonfatal Accidents Per Year
Meanwhile, roofers sustained 6,900 nonfatal injuries or illnesses in the last recorded year, a 17% increase from the previous year.
| Year | Accidents |
|---|---|
| 2021 | 6,900 |
| 2020 | 5,900 |
| Average | 6,400 |
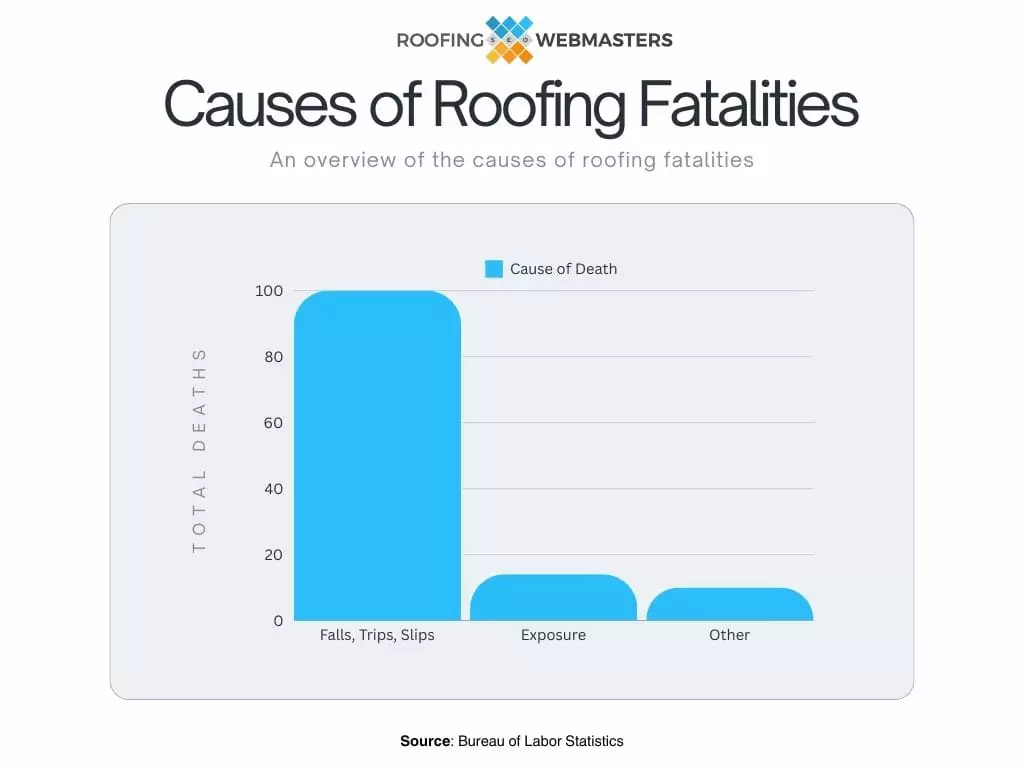
Causes of Roofing Fatalities
The same report reveals that 110 of the 134 roofing deaths came from falls, trips, or slips, which accounts for 82.9% of the roofing fatalities. Exposure to harmful substances or environments accounted for 18 of the fatalities.

Source: Bureau of Labor Statistics
Conclusion
The roofing industry presents workplace injury risks higher than most other professions. While a career in roofing can be profitable and gratifying, it’s important to understand the potential dangers of the job.
Exercising safety precautions is an intelligent decision for anyone in the roofing industry. However, they cannot entirely mitigate the risk of injury or death.


